Sizing Olympus Mons
This work presents updated and more precise information on the overall dimensions of this Martian behemoth - the highest and most prominent volcano in the Solar System - and on some of its key features.Download a paper specifically about the highest point on the mountain based on this work, from EarthArXiv (DOI: 10.31223/X5HN10).The motivation for this effort arises from the fact that not only do reported relief values for Olympus Mons vary widely, many sources don't specify exactly what the stated value is measuring. Published estimates include “40 km (25 mi) from base to summit” (NASA JPL, 2020) [1], “27 km high” (NASA Science, 2016) [2], “26 km high” (USGS, 1994) [3], "over 25 km above the surrounding plains" (Milkovich et al., 2003) [4], “25 km above the surrounding plain” (ESA, 2003) [5], “nearly 25 km above the surrounding plain” (LPI, 2025) [6], “23 km high” (NASA SVS, 2004) [7], “up to 23 km height above base” (McGovern et al., 2004) [8], and “average elevation of 22 km” (ESA, 2004) [9].Among the sources that define their metric, Mouginis-Mark et al., (2002) [10] report: “Olympus Mons is 21.611 km in height, defined as the maximum elevation of the summit minus the average elevation of the perimeter of the volcano at break in slope.”Similarly, reported relief for specific features of the mountain also varies. The encircling basal scarp is described as “6 km tall” (Milkovich et al., 2003) [4], “up to 8 km high” (McGovern et al., 2007) [11], “9 km high in places” (Borgia et al., 2015) [12], and “up to 10 km high” (McGovern et al., 2004) [8].When a primary source is cited for Olympus Mons’ summit elevation, relief, or slope, it is often Plescia (2004) [13]. That study is based on Mars Orbiter Laser Altimeter (MOLA) data (as is [10]), and reports a relief of 21.9 km “above the surrounding plain”, measured from either “the bottom of the basal scarp” or “the location of the change in slope of the scarp-draping flows”. However, the study is now over two decades old, and more detailed elevation models have since become available. For the analysis presented here, I've used the 2018 global 200m-resolution MOLA+HRSC (High Resolution Stereo Camera) blended digital elevation model (DEM) [14], which combines the vertical accuracy of MOLA with the higher spatial resolution of HRSC stereo imaging.All elevation values are given relative to the Martian reference datum - a spherical surface with a radius of 3396.19 km.
Summit Detail
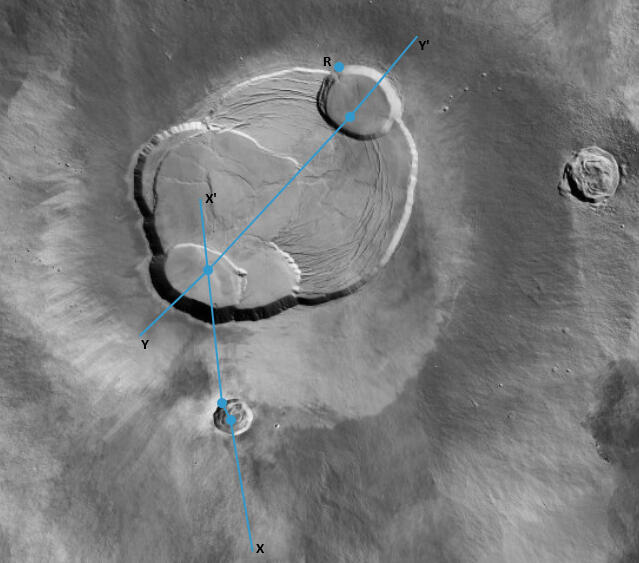
Fig 1
Let’s take it from the top. The highest point of Olympus Mons - its summit elevation - is 21226m, and occurs not at the caldera complex on the summit plateau as one might expect, but on the rim crest of a somewhat polygonal impact crater called Pangboche (named after a Himalayan village in Nepal), which is 10.8 km at its widest.
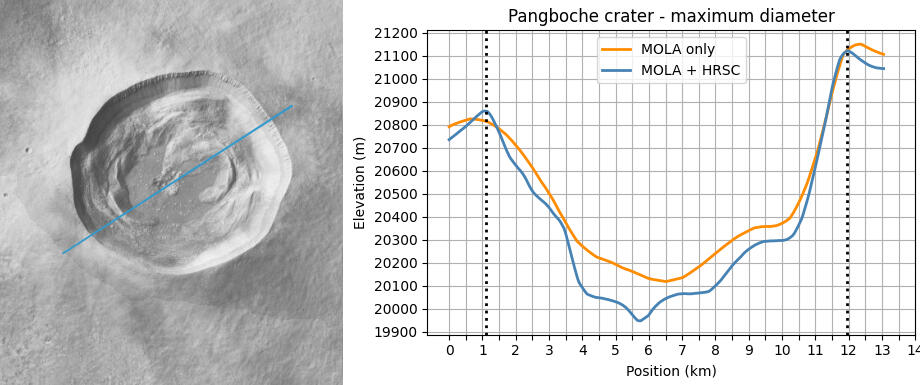
Fig 2
In Fig 2, the left panel shows a high-resolution CTX (Context Camera) image of Pangboche, with the blue transect spanning its widest extent. The right panel plots the elevation profile along this transect. The orange profile is generated from a MOLA-only DEM, and is included to show that it has insufficient resolution to capture the central cluster of pits where Pangboche’s lowest elevation lies.Very few impact craters of Pangboche’s size or larger are found on Olympus Mons, indicating that the mountain’s present surface is geologically young. Pangboche’s rim crest lies 21.3 km from the nearest edge of the caldera. Without this impact, the elevation of Olympus Mons at that location would be 276m lower than it is.
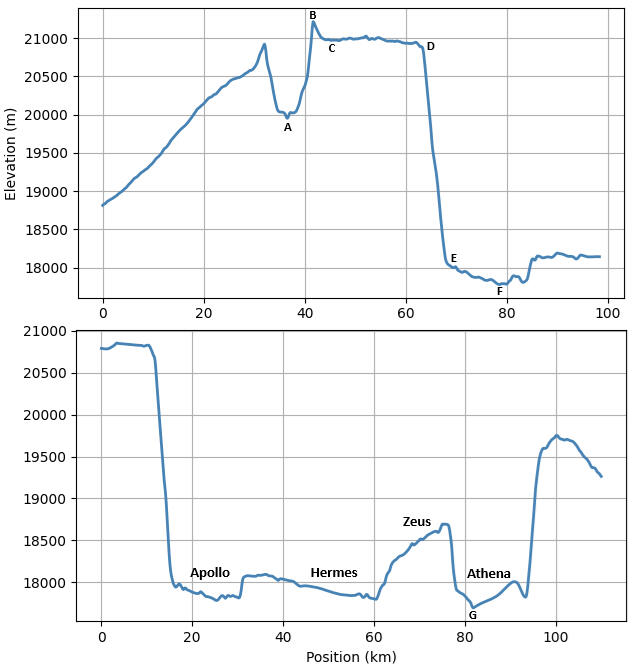
Fig 3
Olympus Mons' summit caldera complex consists of six nested craters, collectively known as Olympus Paterae. In 2017, the International Astronomical Union (IAU) named each of these features after Olympian gods, once believed to have lived atop Mount Olympus, the highest peak in Greece.Fig 1 shows a CTX camera image of Olympus Paterae from above, and Fig 4 presents a 3D render of Olympus Paterae and Pangboche generated from the MOLA+HRSC DEM, produced by exporting a data cube of the Olympus Mons region from Mars QuickMap [16]. (All such renders in this work are shown with some vertical exaggeration). Fig 3 displays the elevation profiles along the transects marked in Fig 1: the top panel corresponds to the X-X′ transect, and the bottom panel to the Y-Y′ transect.
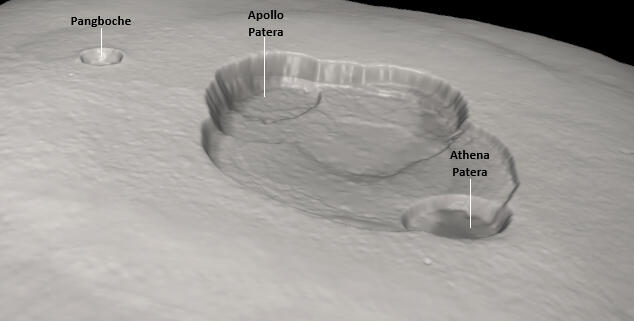
Fig 4
The caldera rim, defined by the points on the summit plateau where descent into the caldera begins, has its highest elevation along the southern rim of Apollo Patera, and its lowest at the northern rim of Athena Patera - a difference of 1354m.The deepest point within Olympus Paterae is also in Athena Patera, 3221m below the highest rim point, and 2256m below the lowest point on the floor of Pangboche crater.The floors of individual paterae are tilted. Both Apollo and Hermes Patera slope upward toward the highest rim point - Apollo rising 130m across its floor, and Hermes rising 270m. Zeus and Athena Patera slope away from it: Zeus shows an elevation gain of 895m toward Athena’s rim, and Athena Patera’s floor rises 322m from its deepest point to a mound at the base of its northeastern wall. These varying depths and slope profiles reflect a complex volcanic history. The paterae likely formed at different times, each with its own evolving magma plumbing system - featuring multiple subsurface reservoirs, shifting centers of activity, collapse from magma withdrawal, and uplift from renewed intrusion.With reference to the charts in Fig 3, Table 1 lists principal measurements for the summit region of Olympus Mons.
| Metric | Location | Value | Significance |
|---|---|---|---|
| Point Elevation | A | 19939m at [17.26571, -133.40843] | Lowest point within Pangboche crater |
| Point Elevation | B | 21226m at [17.34337, -133.44894] | Rim crest of Pangboche crater. Also highest point on Olympus Mons, and highest elevation on Mars |
| Point Elevation | C | 20950m | Local summit elevation predating the Pangboche impact |
| Point Elevation | D | 20904m | Highest point on the rim of Olympus Paterae |
| Point Elevation | E | 18060m | Base of Apollo Patera wall |
| Point Elevation | F | 17780m at [17.96420, -133.51328] | Lowest point within Apollo Patera |
| Point Elevation | R (Fig 1) | 19950m at [18.91024, -132.90024] | Lowest point on the rim of Olympus Paterae |
| Elevation Difference | B to A | 1287m | Maximum depth of Pangboche crater |
| Elevation Difference | B to C | 276m | Elevation increase at summit plateau due to Pangboche impact |
| Distance | C to D | 21.3 km | Shortest distance from Pangboche crater to Olympus Paterae |
| Elevation Difference | D to E | 2825m | Maximum caldera wall relief within Olympus Paterae |
| Elevation Difference | D to F | 3105m | Maximum depth of a patera within Olympus Paterae |
| Slope | D to E | 32° | Among the steepest wall base to rim slopes within Olympus Paterae |
| Point Elevation | G | 17683m at [18.67951, -132.85176] | Lowest point within Olympus Paterae |
| Elevation Difference | A to G | 2256m | Vertical offset between lowest point of Pangboche crater and lowest point of Olympus Paterae |
| Elevation Difference | D to G | 3221m | Maximum depth of Olympus Paterae |
| Elevation Difference | D to R | 1354m | Olympus Paterae rim relief |
Table 1
Key Features
The four 3D renders in Fig 5, made from the MOLA+HRSC DEM, show Olympus Mons and its immediate surrounds from all sides.
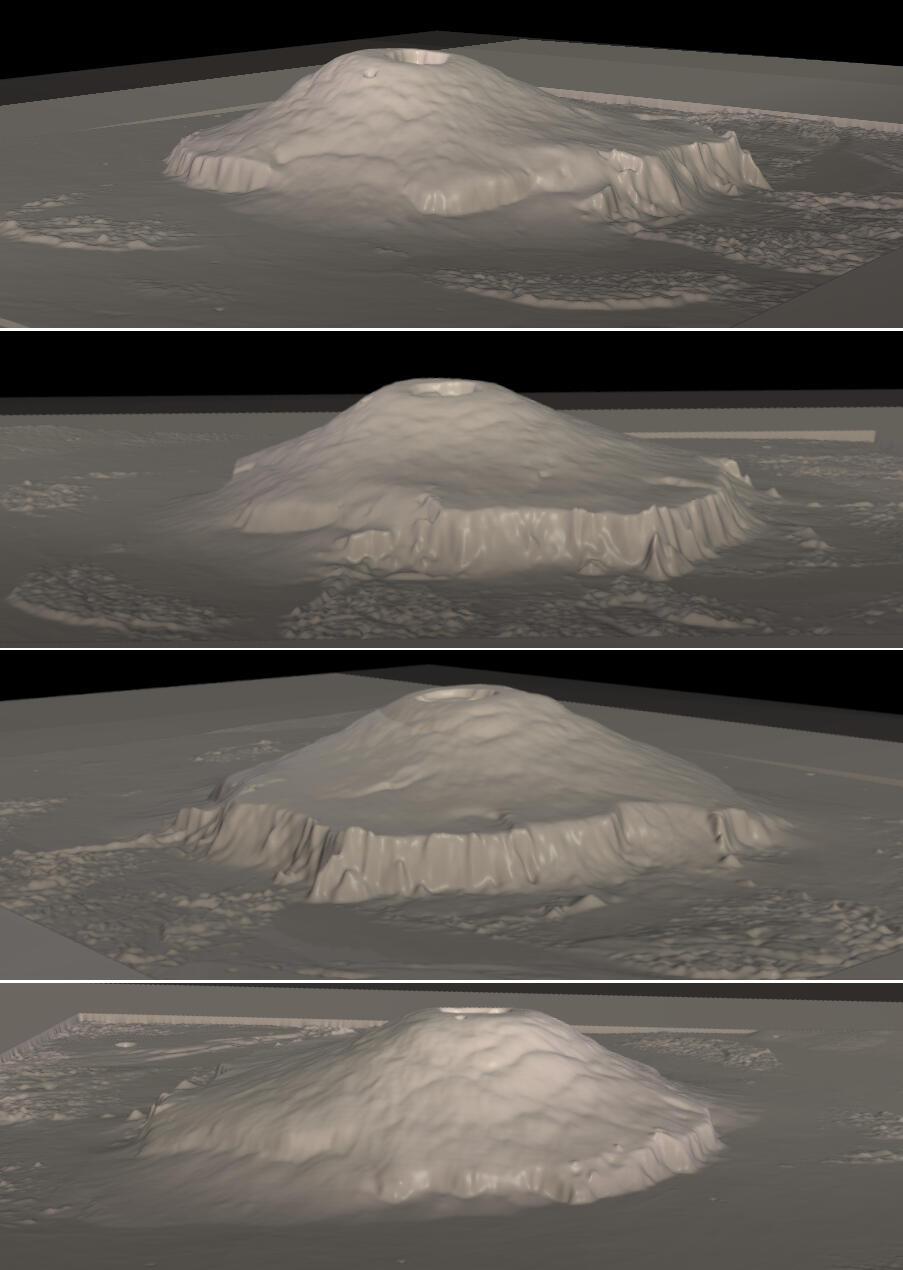
Fig 5
A few key characteristics are evident from these visualizations:a) The broad summit plateau, hosting Olympus Patera.b) The asymmetrical profile of the mountain, with its flanks extending much further to the northwest than to the southeast.c) The flanks scalloped by a series of stacked, curved terraces that resemble overlapping fish scales. These may have formed as the weight of the volcano slowly bent the Martian crust, causing parts of the surface to compress and break along thrust faults.d) The sloping base - the mountain sits on the northwestern margin of the Tharsis bulge - a large, uplifted volcanic plateau (Fig 6). The volcano occupies a transition zone where Tharsis slopes down toward the lowland Amazonis Planitia. As a result, its base lies on a pre-existing regional slope inherited from Tharsis uplift.e) The basal scarp - the mountain is ringed by a steep escarpment, which may have formed through gravitational spreading and collapse of the volcano’s flanks. It's most pronounced along the northwestern and southeastern edges of the volcano. In the northeast and southwest, lava flow sheets have overtopped or buried sections of the scarp, producing smooth ramps where the flank merges more seamlessly into the adjacent terrain (Fig 7).f) In the right portion of the second frame from top, a ‘gash’ descends the lower slope toward the circumferential basal scarp. This is a radial scarp, shown in greater detail and discussed in Fig 9.g) Rugged deposits around the mountain - lobes of broken rock called aureole deposits, spread out across the plains. These were likely formed by huge landslides as parts of the volcano’s flanks gave way and slid outward.
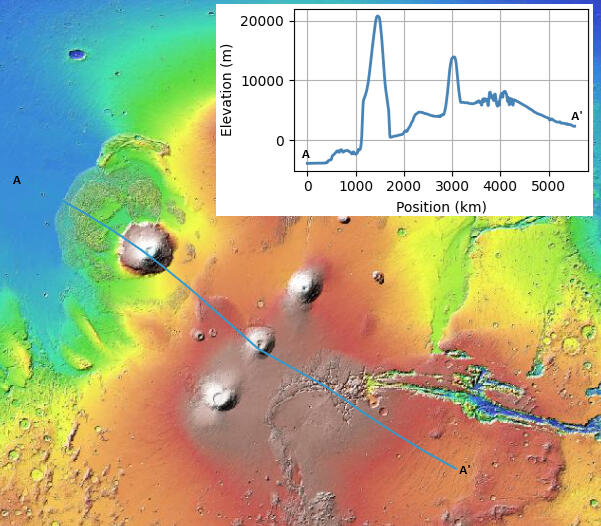
Fig 6 Tharsis Bulge
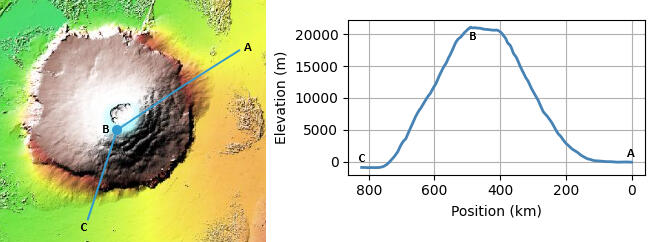
Fig 7 No scarp locations
Fig 8 shows the elevation profile at the highest part of the basal scarp. This profile is along the transect A'-B in Fig 17. Here the scarp rises from a floor elevation of -2480m, to 8025m at the summit of a ridge along its edge, giving a total scarp height of 10505m. This ridge stands 1855m above the flank plateau at 6170m (near the plateau’s highest point of 6190m, about 12 km away), so what looks like a 'lip' at the top of the scarp in the profile chart is actually a decent mountain by Earth standards. Excluding this ridge, the relief from scarp floor to flank plateau is 8650m.
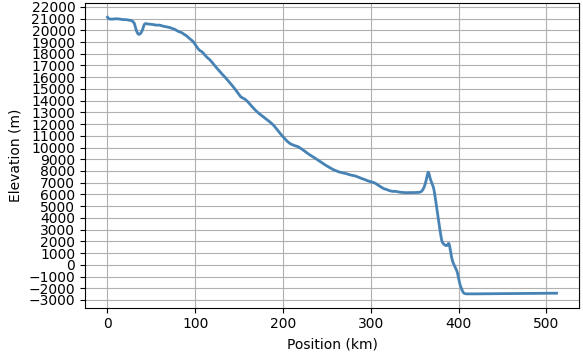
Fig 8 Highest scarp location
Fig 9 top panel is a 3D render of the location of the elevation profile in Fig 8, made from the MOLA+HRSC DEM.
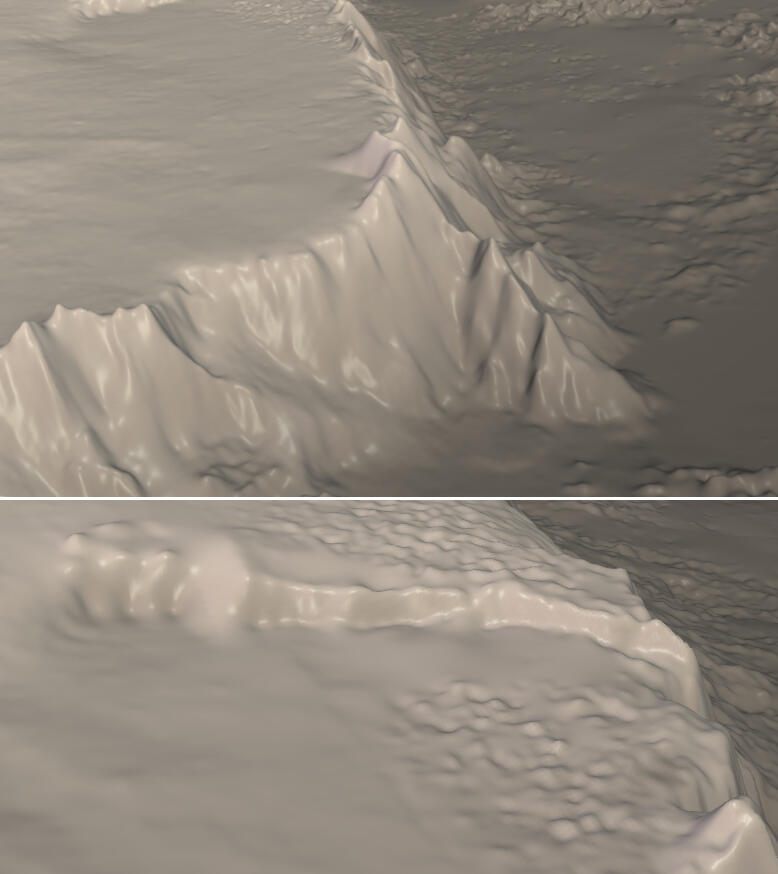
Fig 9
Fig 9 (bottom panel) shows a 3D render of a radial scarp, part of which is just visible along the upper edge of the top panel. Such features may have formed through a combination of strike-slip and normal faulting along pre-existing weak zones, triggering landslides or sector collapses (sections of the volcano breaking away). This example is about 60 km long and exhibits the greatest relief of any radial scarp on Olympus Mons, in places exceeding 1 km between the flank plateau and the scarp crest.
How tall is Olympus Mons? To determine that, we first need to decide where its base lies. There's a couple of ways of defining it:
Base by lowest closed contour (Prominence Base)
Base by slope break boundary (Base)
Topographic Prominence
Topographic prominence studies commonly use contour lines to identify a mountain’s base. Contour lines are lines of equal elevation on terrain. The lowest contour line that fully encircles Olympus Mons without connecting to another contour or opening into surrounding terrain is its Prominence Base. The height difference between the elevation of this contour (the Prominence Base Elevation) and the summit gives the mountain's Prominence Relief.
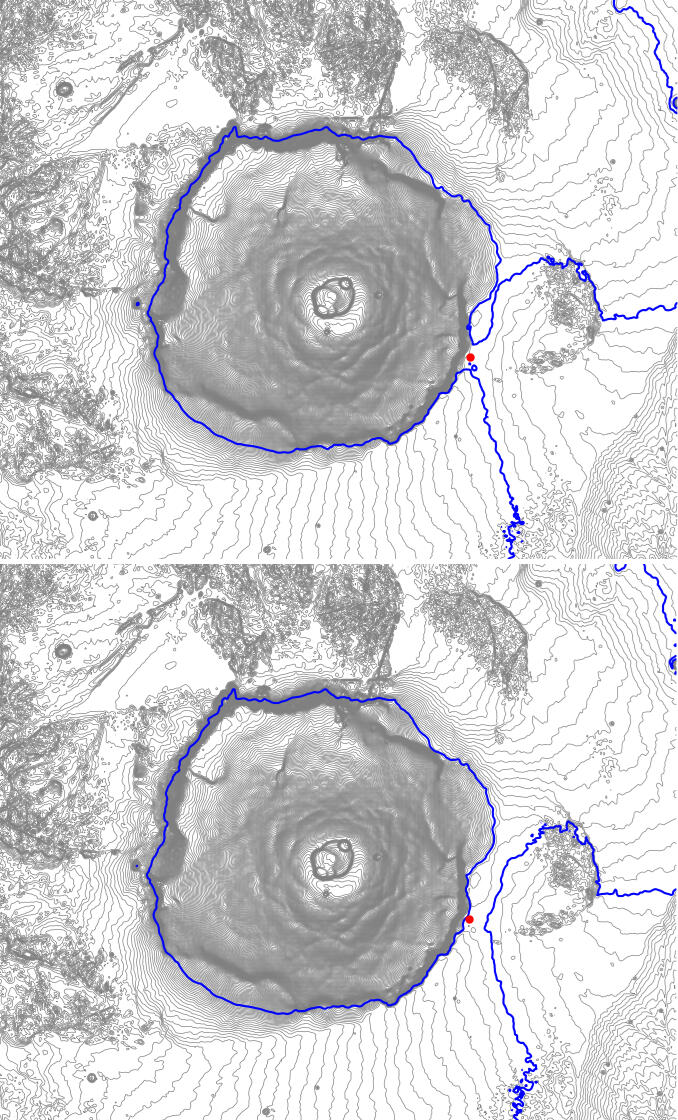
Fig 10
In Fig 10, 100m-spaced elevation contours derived from the MOLA+HRSC DEM are shown around Olympus Mons. These were produced in QGIS from a data cube of the region exported from Mars QuickMap [16]. In the bottom panel, the lowest fully closed contour, in blue, lies between 890m and 900m. The top panel shows that the next lower contour (800-810m) opens toward the southeast and merges with adjacent terrain, so the Prominence Base Elevation must lie between 800m and 900m.To pinpoint its value more precisely, the red dot in both panels at [16.47973, -128.88176] is the location of the key col between Olympus Mons and Ascraeus Mons, per Space Ribus Mars [15]. A key col is the highest point that must be descended to from a peak before ascending a higher one; for the highest peak on any planetary body without oceans, it's the col shared with the second most prominent peak. (More planetary examples will be discussed in due course as part of the WorldRibus.org project). At the key col location, the elevation per [15] is 838m. It's where the fully encircling contour first opens out, confirming 838m as the Prominence Base Elevation. So the Prominence Relief of Olympus Mons is: 21226m - 838m = 20388m.
| Metric | Value |
|---|---|
| Prominence Base Elevation | 838m |
| Prominence Relief | 20388m |
Table 2
As an aside, it's worth mentioning the concept of anti-prominence here. Table 1 shows that the difference in elevation between the highest part of Pangboche crater's rim and the lowest point on its floor is 1287m. Per [15], the anti-prominence of Pangboche is 912m, which is the elevation difference between the lowest part of Pangboche's rim and the lowest point on its floor. Conceptually, anti-prominence measures the minimum vertical climb required to leave the crater floor and reach lower terrain outside, analogous to how prominence measures the minimum descent from a summit before climbing a higher peak.
Base-to-Peak Height
The second method of determining the base is based on slope transitions, as follows: draw evenly spaced transects from the summit out across the surrounding terrain. On each transect’s elevation profile, find the point where the slope changes from the mountain's flank to the surrounds. The lowest of these points is the Minimum Base Elevation (and the difference between summit elevation and this value is Maximum Base-to-Peak Height), the highest is the Maximum Base Elevation (Minimum Base-to-Peak Height), and the arithmetic mean of the elevations of all the base points gives the Average Base Elevation (Average Base-to-Peak Height).
Fig 11. This animation demonstrates the method used to identify the base of Olympus Mons. Here eight evenly spaced transects radiate from the summit to the surrounding terrain, with each elevation profile along it displayed in turn. The red dotted line on each profile indicates the base point along that transect. A polar diagram beneath the profiles shows the direction of each transect from the summit in plan view.In the following sections, I use a larger set of transects and analyze the resulting base points.
A couple of challenges in determining the base in this way are: (1) ensuring there's enough transects to capture all the terrain characteristics that can affect base elevation, and (2) there's some subjectivity in identifying where the flank ends, especially where slopes blend into plains or transition to rugged features such as landslides, craters, and rifts around the mountain.In this study base point locations (per Fig 11 examples), are determined as follows: elevation profiles are smoothed with a Gaussian filter to reduce noise and reveal the broader trends. Gradients along this curve are then computed, and the resulting slope signal is analyzed with the Python ruptures library to detect statistically significant change points - locations where slope behaviour shifts. Custom rules then select a representative 'base point' from these candidates.
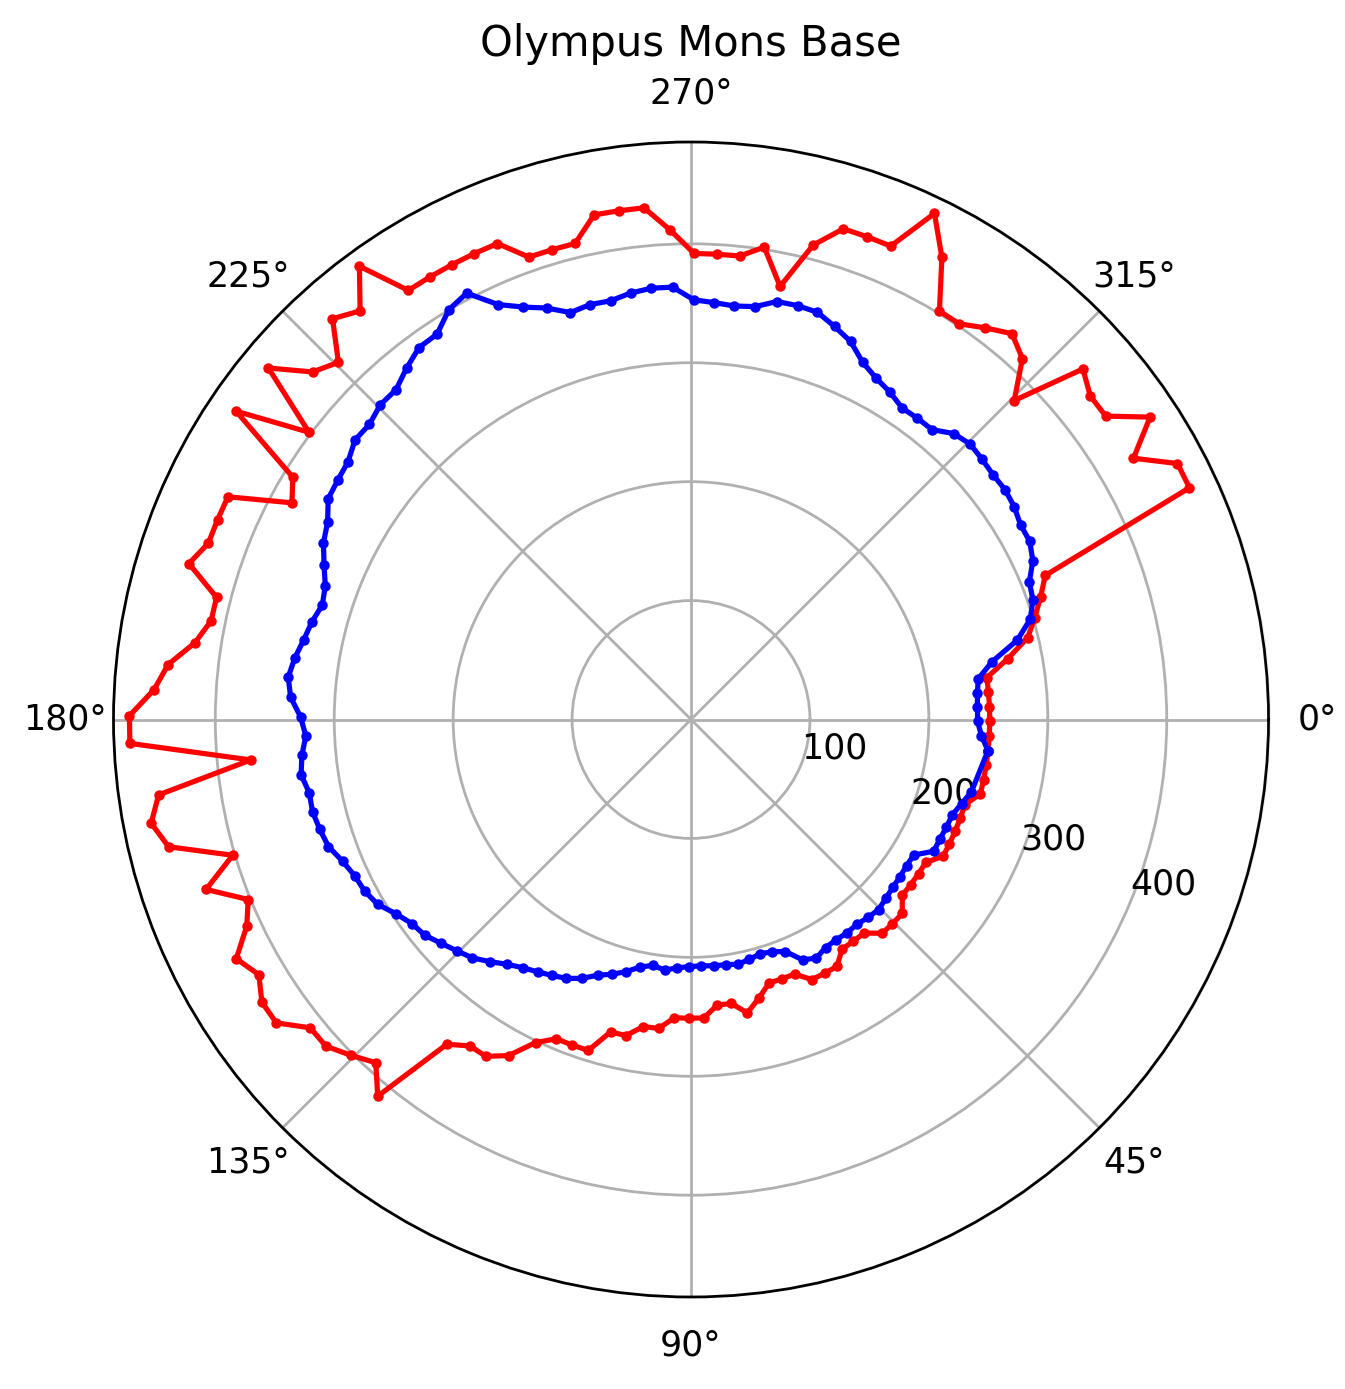
Fig 12
Fig 12 shows Olympus Mons' Base outline in red, determined by the location of base points calculated from 128 evenly spaced transects. Note the lava flow sheets in the northwest and southeast 'pushing out' the Base boundary at those locations. For comparison, the Prominence Base of the mountain is also shown in blue - defined by location of the points of Prominence Base Elevation along each transect.
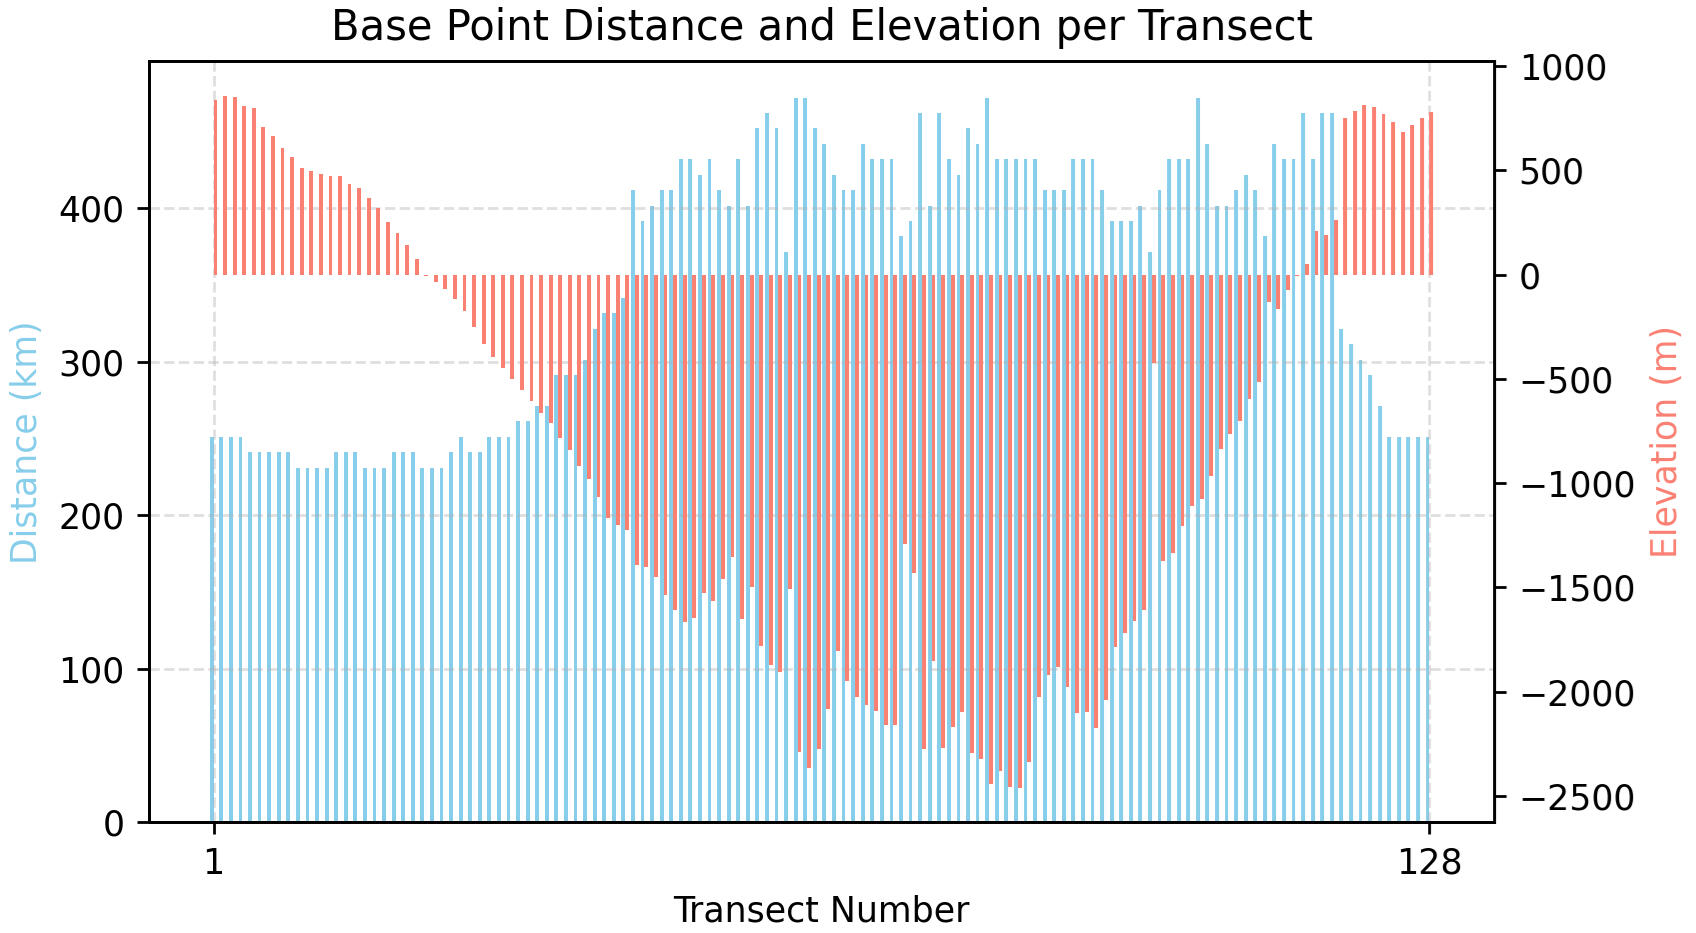
Fig 13
Figure 13 plots the horizontal distance of base point from summit, against its elevation for each of the 128 transects. The plot shows a clear correlation: base points located closer to the summit tend to lie at higher elevations, and those further out are lower. Note the two distinct clusters of red columns which dip lower than the rest, marking the regions around the mountain with the lowest base elevations.
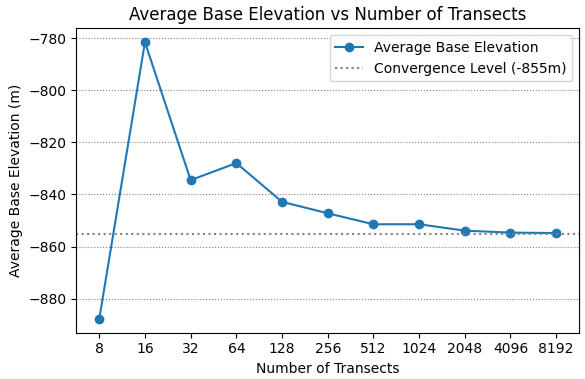
Fig 14
How many transects are needed to calculate reliable metrics for the base? Figure 14 shows that increasing the number of transects refines the Average Base Elevation, consistent with the law of large numbers. With 128 transects, the key topographic features around the mountain’s periphery are already reasonably well sampled. As the transect count doubles, the Average Base Elevation converges toward -855m. By 8192 transects, changes fall below the metre scale, so this value is adopted in this study for calculating base statistics.
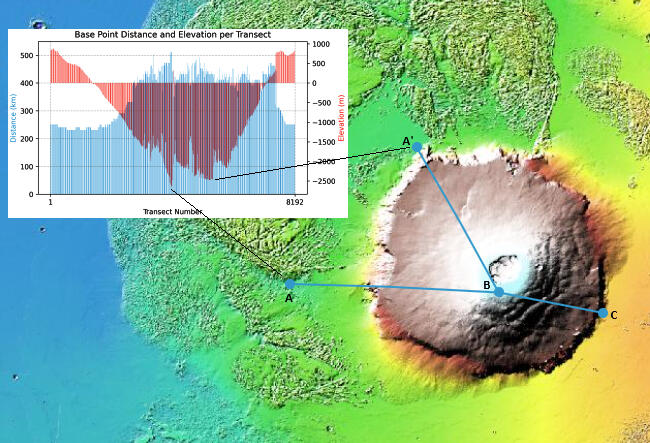
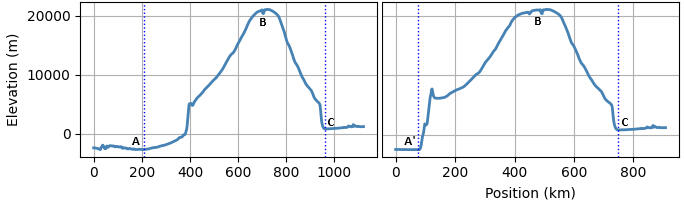
Fig 15
The top panel of Fig 15 plots base point distance and elevation for 8192 transects. The two clusters of red columns dipping below the surrounding values correspond to the ones in Fig 13 with 128 transects, but are more clearly defined here. The panel also marks the positions of the lowest elevations from each cluster, as well as the location of the Maximum Base Elevation, overlaid on an a plan view of the mountain. The Maximum Base Elevation, 876m, lies along the same transect - and close to - the key col point (see Fig 10). The bottom panel contrasts the elevation profiles of the two lowest base regions: one contains the point of Minimum Base Elevation, which lies on a gentle slope away from the scarp; in the other region, the lowest point occurs at the foot of the scarp’s highest section.Table 3 summarizes the various metrics for base elevations, and base to peak height, from the 8192 transects across Olympus Mons.
| Metric | Value |
|---|---|
| Maximum Base Elevation | 876m |
| Minimum Base-to-Peak Height | 20350m |
| Minimum Base Elevation | -2661m |
| Maximum Base-to-Peak Height | 23887m |
| Average Base Elevation | -855m |
| Average Base-to-Peak Height | 22081m |
| Standard Deviation of base point elevations | 1086m |
| Median Base Elevation | -935m |
| Median Base-to-Peak Height | 22161m |
Table 3
With the base point distance and elevation for all 8192 transects, we can derive metrics for the cross-section widths of Olympus Mons - the horizontal distance from every base point to the base point on the opposite side of the mountain, across the summit. We can also calculate the area enclosed by the Base by connecting all base points (as illustrated in Fig 12 for a smaller number of transects) and applying the shoelace method for determining the area of a polygon from its vertices. The results are shown in Table 4.
| Metric | Value |
|---|---|
| Maximum Base Width | 954.6 km |
| Minimum Base Width | 602.9 km |
| Average Base Width | 714.5 km |
| Median Base Width | 693.3 km |
| Area of Base | 425107 km² |
Table 4
Table 5 shows the equivalent metrics in Table 4 for the Prominence Base (defined by the location of the points of Prominence Base Elevation along all 8192 transects across the mountain):
| Metric | Value |
|---|---|
| Maximum Prominence Base Width | 633.8 km |
| Minimum Prominence Base Width | 556.3 km |
| Average Prominence Base Width | 587.5 km |
| Median Prominence Base Width | 579.7 km |
| Area of Prominence Base | 281773 km² |
Table 5
Both topographic prominence and base to peak measurements are useful in their own way. Topographic prominence has a conceptual elegance: it measures how independent a peak is from its surroundings, defining the base with a single value, making the result simple, reproducible and resistant to arbitrary choices about where a mountain 'starts'. It's especially valuable for distinguishing distinct peaks within complex, interlocking mountain systems, and is widely used in mountain classification and peak-bagging contexts.On the other hand, base to peak height captures the full vertical extent of a landform from where it rises to its summit. For Olympus Mons, this measure reflects the volcano’s structural, geological, and erosional context better than a single saddle contour. It conveys the absolute size of the edifice, relevant to formation energy, gravitational collapse, lava flow reach, and slope calculations (the subject of the next section), which in turn, inform mass balance studies.
Slope
Two methods are used to determine the slope of Olympus Mons:
Best-Fit Slope (Polyfit Method): A straight line is fitted between base point and summit along each transect using linear regression (polyfit). The slope of this line is recorded as the overall gradient for each transect.
Piecewise Slope: The slope between each pair of consecutive elevation points along the transect is calculated, forming a series of short linear segments that follow the mountain's profile. The average of these segment slopes is recorded as the overall gradient for each transect.
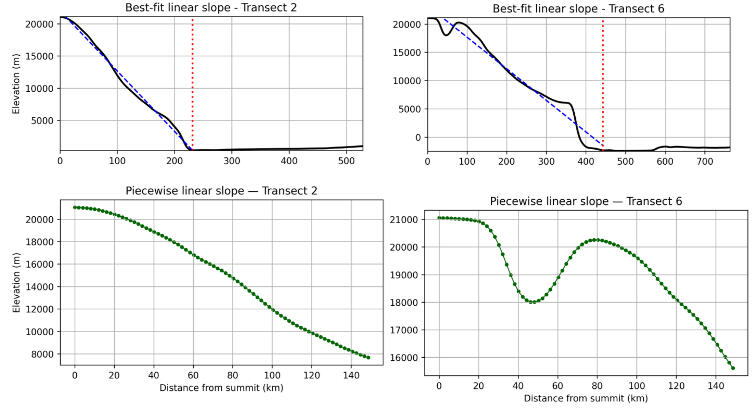
Fig 16
In Fig 16, the left panels show a linear slope fit to a reasonably straight base point to summit flank, with only the upper-flank points shown for the piecewise slope to preserve visual clarity (displaying the full flank would obscure the individual points). The right panels present the same for a more complex profile. The transect numbers pertain to the frames in Fig 11.
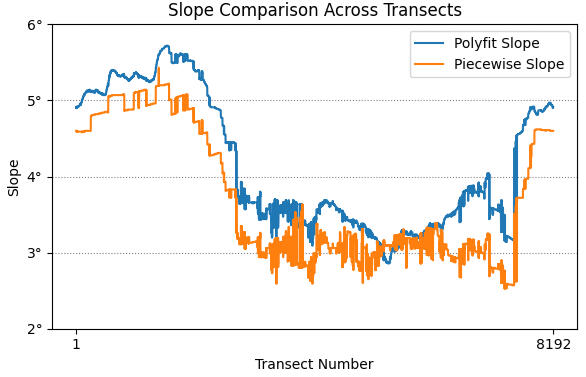
Fig 17
Fig 17 presents the slope results for 8192 flank profiles. As expected, both slope calculation methods produce similar trends, though the piecewise approach consistently yields slightly gentler angles across all transects. Because the summit is closer to some parts of the Base boundary than others, transects in the direction of the shorter Base distance tend to have steeper slopes, and those extending toward more distant edges are shallower. Slopes are also notably shallower where lava ramps overlay the flank.
| Metric | Value |
|---|---|
| Maximum Best-Fit Slope | 5.72° |
| Minimum Best-Fit Slope | 2.86° |
| Average Best-Fit Slope | 4.15° |
| Maximum Piecewise Slope | 5.43° |
| Minimum Piecewise Slope | 2.53° |
| Average Piecewise Slope | 3.71° |
Table 5
Table 5 presents the key metrics from slope data collected for all transects.
Conclusion
This study has presented morphometric measurements of Olympus Mons and its features using the highest-resolution global DEM of Mars currently available. It provides a consistent reference for values of both general interest and geomorphological significance. Compared to measurements derived from earlier MOLA-only DEMs, the results here are more precise, and also explicitly tied to the features they describe, removing ambiguity in interpretation. For example, based on some of the tabulated values in this work, one can state that Olympus Mons has:
A summit elevation of 21226m from a Mars reference radius of 3396.19 km.
A topographic prominence of 20388m, defined as the summit elevation minus the elevation of the lowest contour that fully encircles the mountain.
An average base-to-peak height of 22081m, defined as the summit elevation minus the average elevation of the mountain's perimeter at the break in slope, measured along 8192 equally spaced transects from summit to surrounding terrain.
A linear-fit slope angle from the break in slope to the summit, ranging from 2.86° to 5.72° with an average of 4.15°, based on the same 8192 transects.
Author
This study was carried out by Jim Singh and completed on 15 August 2025. It stems from an ongoing collaboration with Daniel Quinn and Oscar Argudo to systematically catalogue all lunar and Martian mountains and craters with topographic prominence (or anti-prominence) of at least 1000m. The effort builds on a 2024 publication documenting 7149 such features on Earth. Progress updates are available at WorldRibus.org.
References
[1] NASA Jet Propulsion Laboratory. (2020, April 1). PIA23818: Olympus Mons summit [Image]. NASA. https://www.jpl.nasa.gov/images/pia23818-olympus-mons-summit/[2] NASA Science. (2016, February 1). Viking 1 orbiter image: Olympus Mons [Digital mosaic]. NASA. https://science.nasa.gov/resource/viking-1-orbiter-image-olympus-mons/[3] U.S. Geological Survey. (1994). Atlas of volcanic landforms on Mars (Professional Paper 1534) [Government Report]. https://pubs.usgs.gov/pp/1534/report.pdf[4] Milkovich, S. M., & Head, J. W. III. (2003). Olympus Mons fan-shaped deposit morphology: Evidence for debris glaciers. In Sixth International Conference on Mars (Abstract 3149) [Conference paper]. https://www.lpi.usra.edu/meetings/sixthmars2003/pdf/3149.pdf[5] European Space Agency. (2003, April 11). Olympus Mons: 25 kilometres high is the highest volcano in the Solar System [Image gallery]. ESA. https://www.esa.int/ESA%5FMultimedia/Images/2003/04/Olympus%5FMons%5F25%5Fkilometres%5Fhigh%5Fis%5Fthe%5Fhighest%5Fvolcano%5Fin%5Fthe%5FSolar%5FSystem[6] Lunar and Planetary Institute. (1997). Slide 11. In The red planet: A survey of Mars (2nd ed.) [Online slideset]. https://www.lpi.usra.edu/publications/slidesets/redplanet2/slide%5F11.html[7] NASA/GSFC Scientific Visualization Studio. (2004, April 22). Olympus Mons: Visualization 2870 [Visualization]. https://svs.gsfc.nasa.gov/2870/[8] McGovern, P. J., Smith, J. R., Morgan, J. K., & Bulmer, M. H. (2004). Olympus Mons aureole deposits: New evidence for a flank failure origin. Journal of Geophysical Research: Planets, 109(E8). https://doi.org/10.1029/2004JE002258[9] European Space Agency. (2004, February 11). Olympus Mons – the caldera in close-up. ESA. https://www.esa.int/Science%5FExploration/Space%5FScience/Mars%5FExpress/Olympus%5FMons%5F-%5Fthe%5Fcaldera%5Fin%5Fclose-up[10] Mouginis-Mark, P. J., & Kallianpur, K. J. (2002). Heights of Martian volcanoes and the geometry of their calderas from MOLA data. In 33rd Lunar and Planetary Science Conference (Abstract 1409) [Conference presentation]. https://www.lpi.usra.edu/meetings/lpsc2002/pdf/1409.pdf[11] McGovern, P. J., et al. (2007). New models of volcanic spreading and implications for azimuthal variations in the structure of Olympus Mons, Mars. In Seventh International Conference on Mars (Abstract 3397) [Conference paper]. https://www.lpi.usra.edu/meetings/7thmars2007/pdf/3397.pdf[12] Musiol, S., Holohan, E. P., Cailleau, B., Platz, T., Dumke, A., Walter, T. R., Williams, D. A., & van Gasselt, S. (2016). Lithospheric flexure and gravity spreading of Olympus Mons volcano, Mars. Journal of Geophysical Research: Planets, 121(2), 255–281. https://doi.org/10.1002/2015JE004896[13] Plescia, J. B. (2004). Morphometric properties of Martian volcanoes. Journal of Geophysical Research: Planets, 109(E3). https://doi.org/10.1029/2002JE002031[14] U.S. Geological Survey Astrogeology Science Center. (2018, January 31). Mars MGS MOLA MEX HRSC blended DEM global 200m [Map]. U.S. Geological Survey Astrogeology Science Center. https://astrogeology.usgs.gov/search/map/mars%5Fmgs%5Fmola%5Fmex%5Fhrsc%5Fblended%5Fdem%5Fglobal%5F200m[15] Space Ribus. Mars [Web application tracking features of at least 1000m prominence or anti-prominence]. https://spaceribus.pythonanywhere.com/mars[16] Applied Coherent Technology. Mars QuickMap [Interactive map].
https://mars.quickmap.io/
Created by: Jim Singh - Electrical Engineer, Amateur Astronomer, Science Writer. Last Updated: November 2025. If you've found this site useful or have feedback, please drop me a line at jimmyboysingh. Follow that name with an at, then gmail and finish up with a dot and a com.